More info
Weijia Hu
The bar charts
1.Total death number by states by 10/06/2020.
First, take a look at the first bar chart. There are several states being in really terrible conditions.
I picked states whose number of death is greater than 5000. Then sort them by their death descendingly. Among them, the New York has the highest total deaths number in the USA. The state of California, New Jersey and Texas have the similar numbers and are ranked second, third and fourth respectively.
## No trace type specified:
##   Based on info supplied, a 'bar' trace seems appropriate.
##   Read more about this trace type -> https://plot.ly/r/reference/#bar
## Warning: `arrange_()` is deprecated as of dplyr 0.7.0.
## Please use `arrange()` instead.
## See vignette('programming') for more help
## This warning is displayed once every 8 hours.
## Call `lifecycle::last_warnings()` to see where this warning was generated.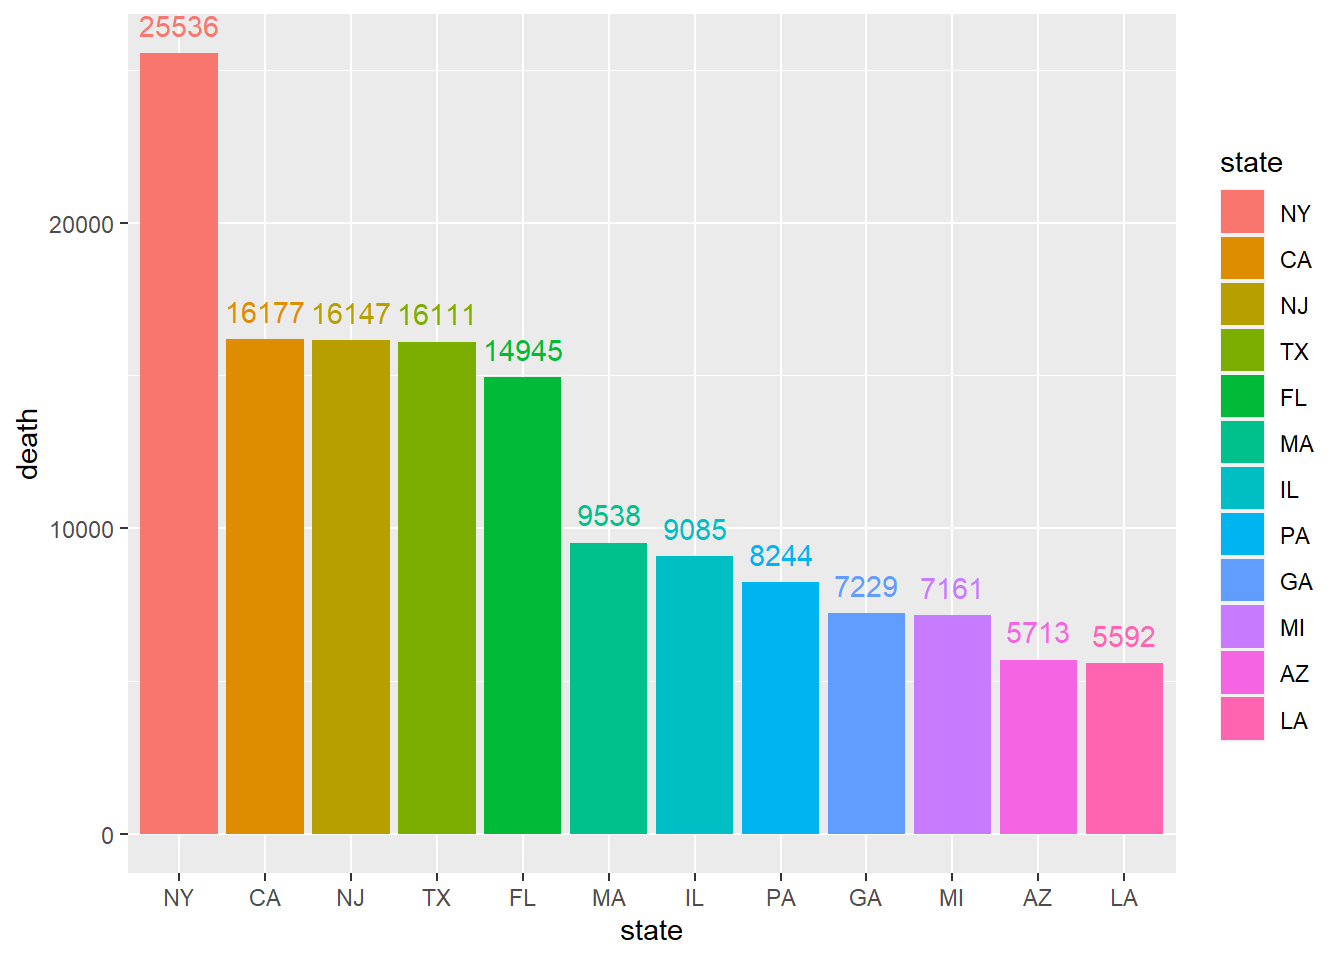
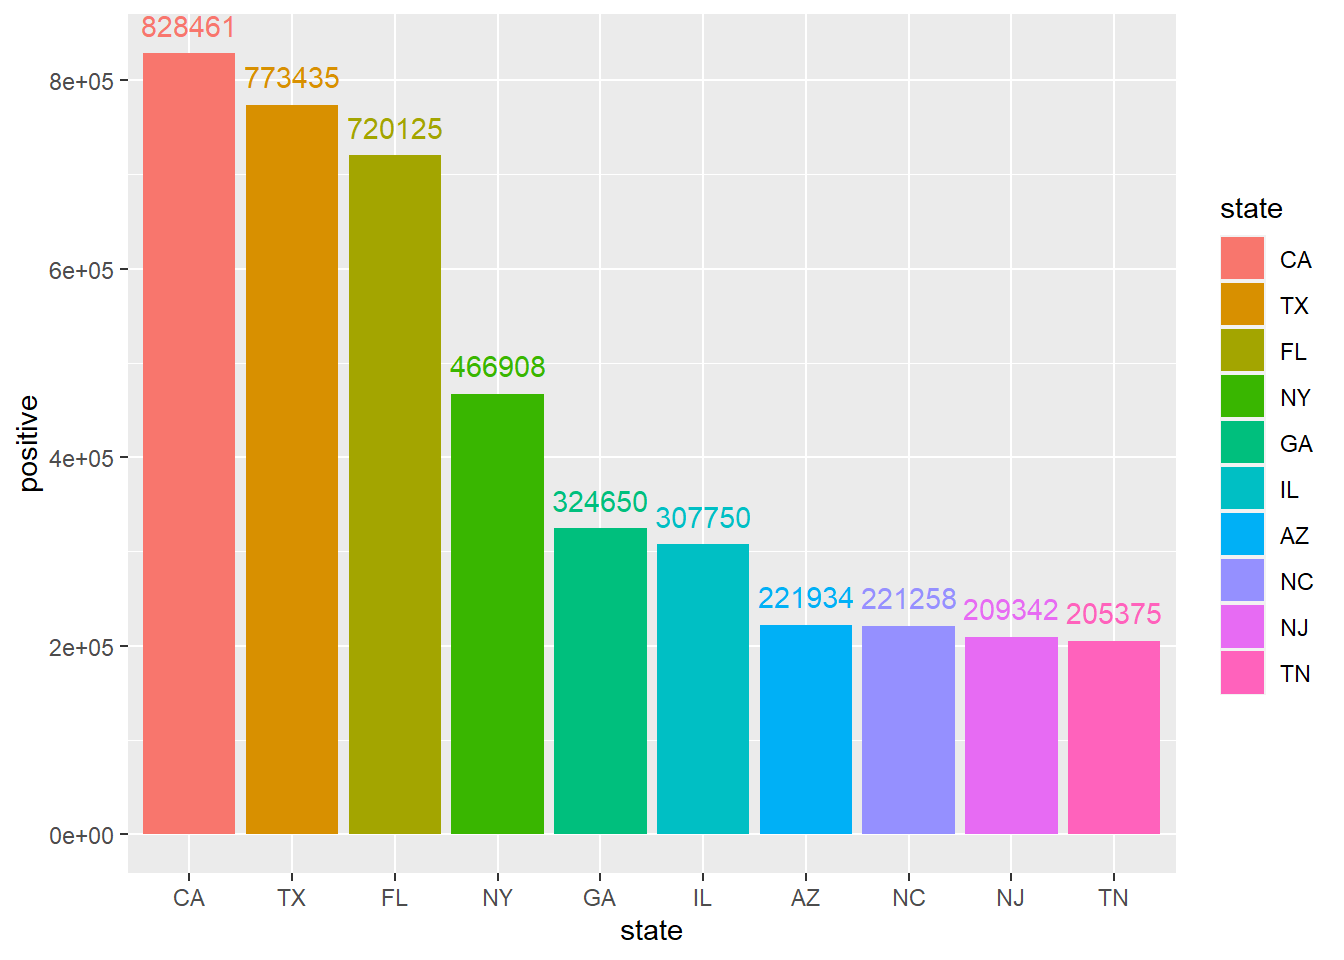
- Total case number by states by 10/06/2020.
Take a look at the first bar chart. There are several states being in really terrible conditions.
I picked states whose number of cases is greater than 20,000. Then sort them by their number of cases descendingly. Among them, the California state has the highest Covid-19-related cases, which is what we all know. Interestingly, the state of New York is only ranked forth, while it has the most deaths.
## No trace type specified:
##   Based on info supplied, a 'bar' trace seems appropriate.
##   Read more about this trace type -> https://plot.ly/r/reference/#bar