PM566 Final Project: Covid-19 research
Weijia Hu
Introduction
In my project, I’m interested in the new cases and deaths of Covid-19. The new cases indicate how fast the virus spread and the deaths indicate how serious this disease is.
Until 10/06/2020, which states contribute most to the new cases and deaths?
Is there any association between the number of hospitalized patients and the number of deaths for Covid-19?
After the National day holiday, did the number of daily new cases increase?
Method
Use bar charts to assess number of cases and deaths among all states.
Use the usmap package to draw maps in order to visually present the data.
As for the associations between hospitalization and death & between holiday and incidence of disease, line charts were used to examine them.
Premilinary results
Summary of the data
Descriptive statistics would be displayed in the “More Info” tab.
The bar charts
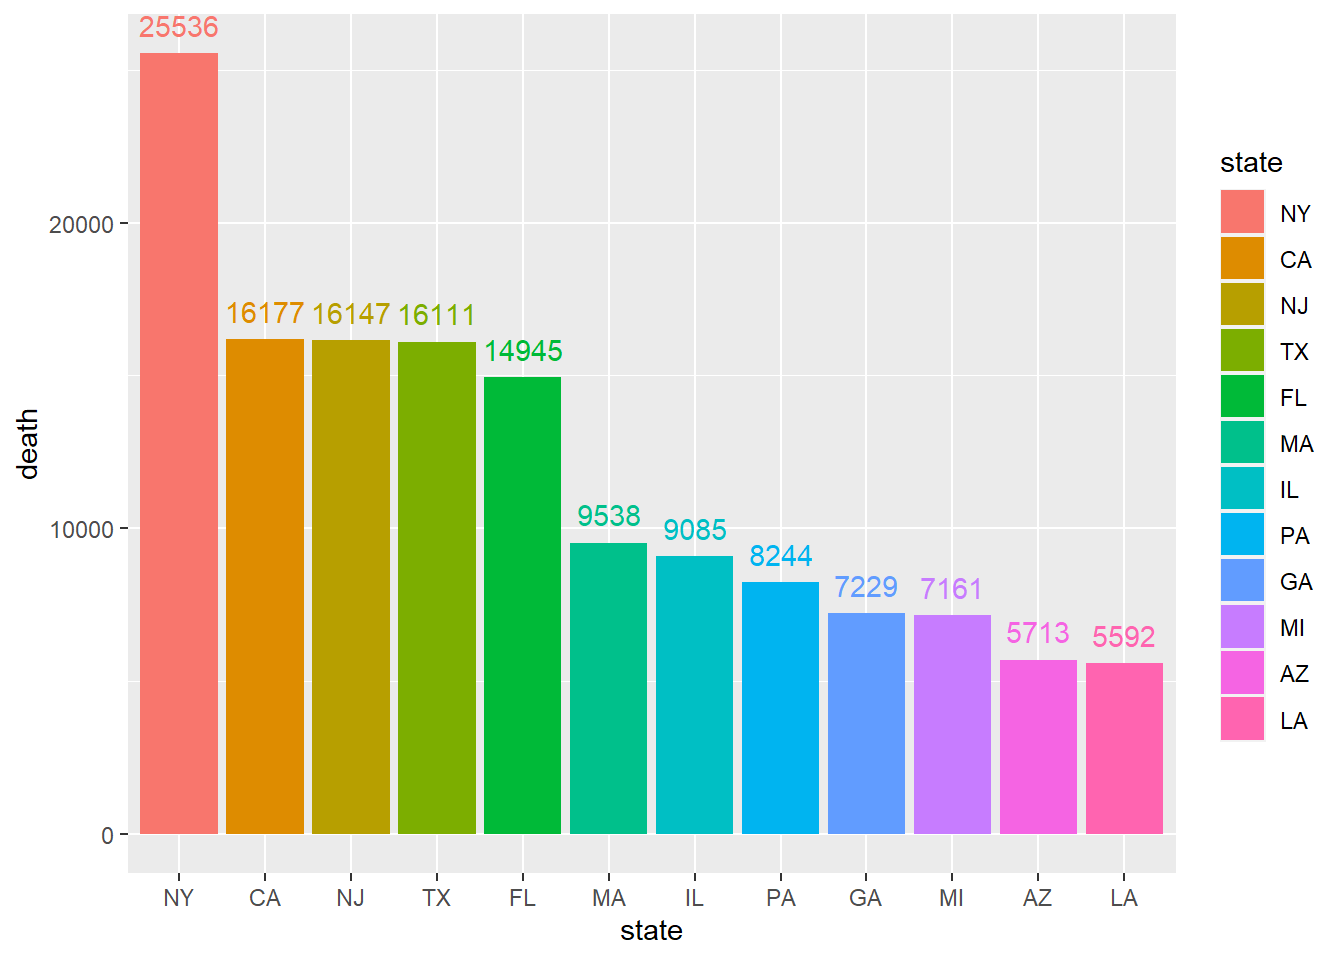
1.Total death number by states by 10/06/2020.
- The New York state has the highest total deaths number in the USA. The state of California, New Jersey and Texas have the similar numbers and are ranked second, third and fourth respectively.
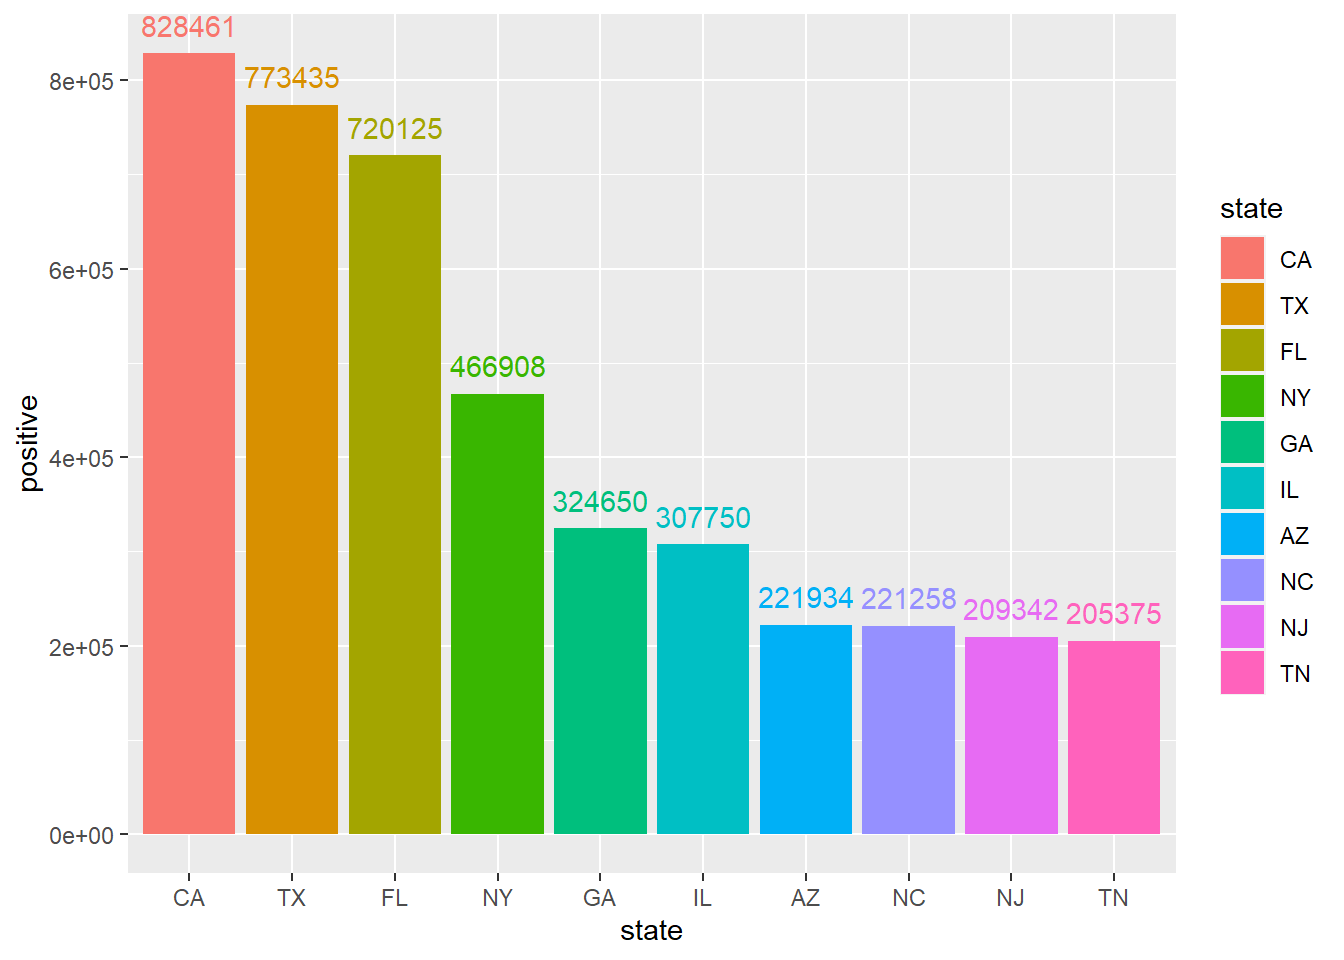
- Total case number by states by 10/06/2020.
- The California state has the highest Covid-19-related cases, which is what we all know. Interestingly, the state of New York is only ranked forth, while it has the most deaths.
The maps
1.Total death number by states by 10/06/2020.
- Total case number by states by 10/06/2020.
Holiday and new cases
Conclusions
The maximum of the daily increase cases is 17820 in a certain state. The mean of th increase for every single state is 879 cases per day. The maximum of the daily increase deaths is 951 in a certain state. The mean of th increase for every single state is 24.83 deaths per day. Based on this, the Covid-19 disease could spread fast but not cause so many deaths (but we still need to wear masks and keep social distance to prevent it!).
According to the scatter plot and its smooth line, the number of deaths and the number of hopitalization have a positive relation. Notice that the confidence intervals are getting lareger. It’s because only some states have very high number of deaths.
I selected a week before and after the National Day to analyze this question. Only in Georgia, after the National Day holiday, the daily increase cases become more. So, I don’t think there is any strong relationship between them.